
Race Condition Debugging

Quick Navigation:
- Race Condition Debugging Definition
- Race Condition Debugging Explained Easy
- Race Condition Debugging Origin
- Race Condition Debugging Etymology
- Race Condition Debugging Usage Trends
- Race Condition Debugging Usage
- Race Condition Debugging Examples in Context
- Race Condition Debugging FAQ
- Race Condition Debugging Related Words
Race Condition Debugging Definition
Race condition debugging refers to the process of identifying, analyzing, and fixing race conditions in concurrent programs. A race condition occurs when multiple threads or processes attempt to access and modify shared resources simultaneously, leading to unpredictable behavior. Debugging these issues requires specialized techniques, including thread synchronization, logging, and the use of debugging tools like thread analyzers, data race detectors, and static code analysis.
Race Condition Debugging Explained Easy
Imagine you and a friend are trying to write on the same whiteboard at the same time, but your markers keep getting mixed up. Sometimes, your words overlap, and sometimes, parts of what you wrote disappear. Debugging a race condition is like figuring out why this happens and making sure each of you takes turns writing so everything stays clear and correct.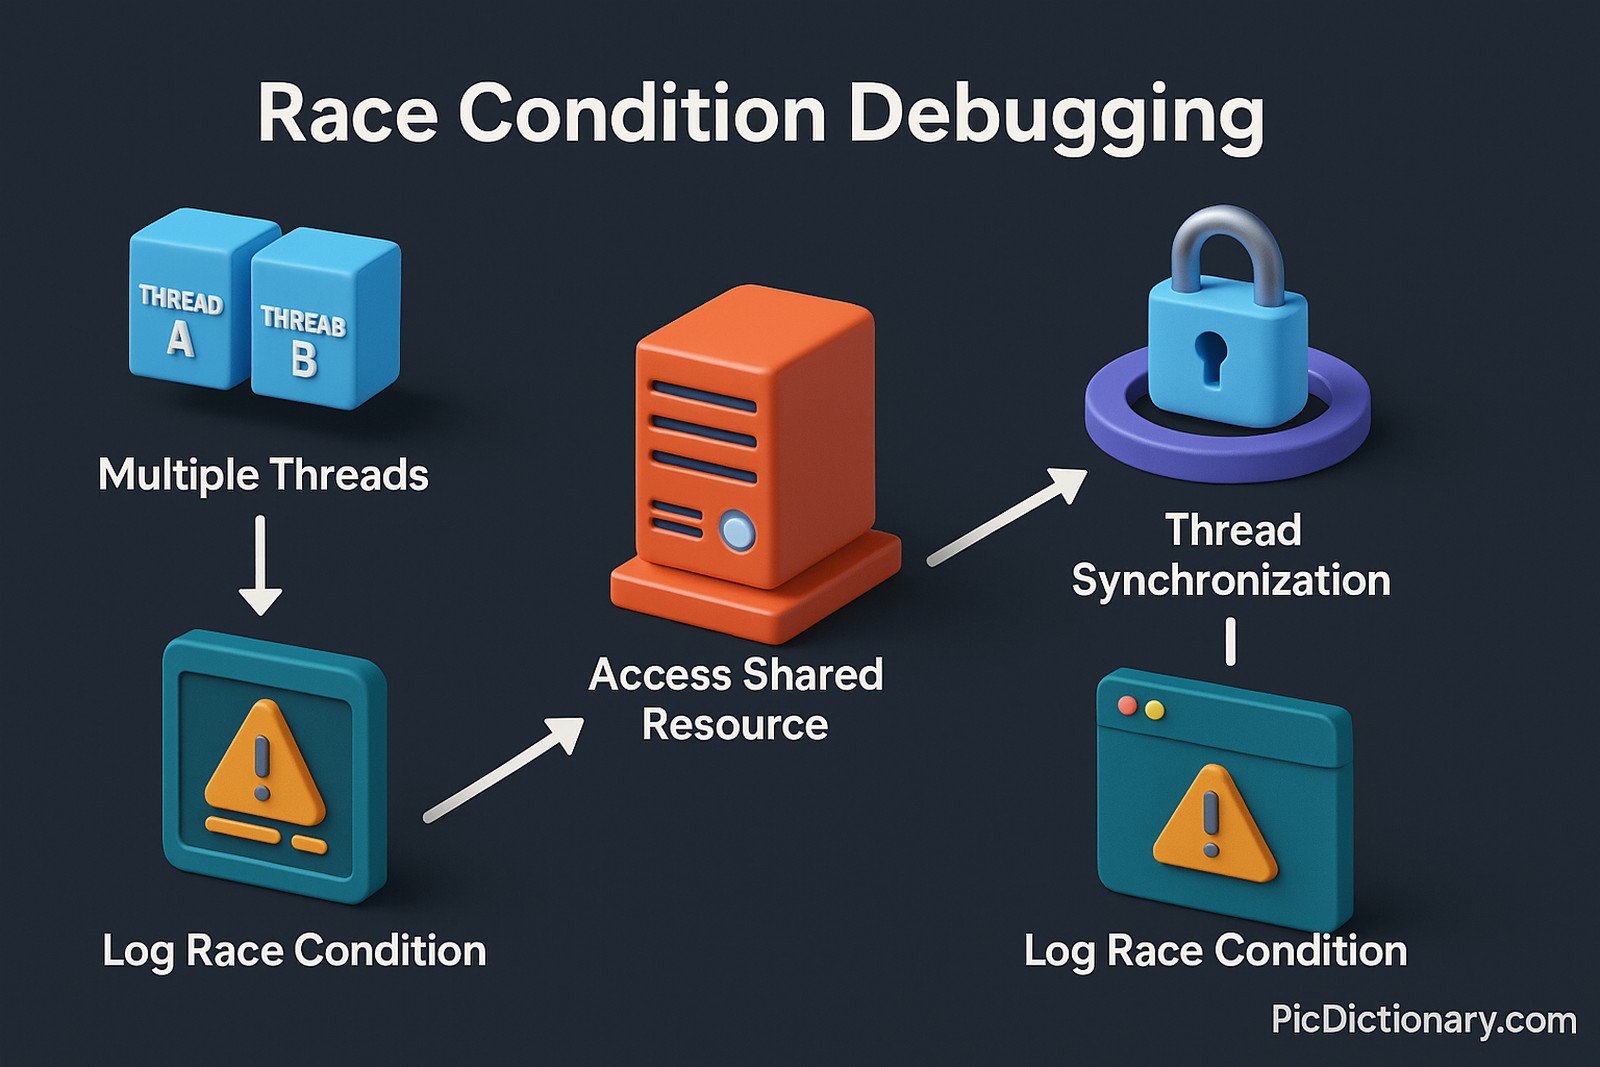
Race Condition Debugging Origin
The concept of race condition debugging emerged with the rise of multi-threaded computing in the 1960s. As computers became more powerful and multi-processing became standard, software engineers needed ways to detect and handle unintended interactions between concurrent threads, leading to the development of debugging tools and methodologies.
Race Condition Debugging Etymology
The term "race condition" comes from the idea of multiple processes "racing" to access shared resources. Debugging refers to the process of identifying and fixing such issues in code.
Race Condition Debugging Usage Trends
With the increasing reliance on multi-threaded applications, race condition debugging has become more crucial. It is widely used in industries that rely on high-performance computing, such as finance, gaming, operating systems, and real-time embedded systems. The rise of parallel programming frameworks like OpenMP and CUDA has also amplified the need for better debugging techniques.
Race Condition Debugging Usage
- Formal/Technical Tagging:
- Concurrency
- Multithreading
- Parallel Computing - Typical Collocations:
- "race condition detection"
- "thread synchronization issue"
- "debugging concurrency problems"
- "data race analysis"
Race Condition Debugging Examples in Context
- A banking application that allows two users to withdraw money simultaneously could experience a race condition if the account balance updates incorrectly.
- In a multiplayer game, a race condition could cause incorrect score calculations when multiple players finish at the same time.
- Operating systems employ race condition debugging to prevent processes from accessing system resources in an inconsistent order.
Race Condition Debugging FAQ
- What is race condition debugging?
It is the process of identifying and fixing issues in concurrent programs where multiple threads interfere with each other. - Why are race conditions problematic?
They cause unpredictable behavior, data corruption, and crashes in multi-threaded applications. - How can race conditions be detected?
Using tools like ThreadSanitizer, Helgrind, and runtime logging. - What are some common fixes for race conditions?
Employing locks, semaphores, atomic operations, and thread synchronization. - Can race conditions occur in single-threaded programs?
No, they typically arise in concurrent or multi-threaded environments. - Which programming languages are most affected by race conditions?
Languages that support multi-threading, such as C, C++, Java, and Go. - What is deadlock in relation to race conditions?
A deadlock occurs when two or more threads are stuck waiting for each other indefinitely. - Is debugging race conditions difficult?
Yes, because they are often intermittent and hard to reproduce. - Are there automated tools for race condition debugging?
Yes, tools like Valgrind, Race Detector (Go), and Clang ThreadSanitizer help in detection. - How can race conditions be prevented?
By designing thread-safe code, using proper synchronization techniques, and following best concurrency practices.

Race Condition Debugging Related Words
- Categories/Topics:
- Concurrency
- Parallel Computing
- Software Debugging
Did you know?
In 2014, a race condition bug in a Bitcoin exchange led to double spending, allowing some users to withdraw funds multiple times. This vulnerability caused significant financial losses and highlighted the importance of thorough race condition debugging in financial systems.
PicDictionary.com is an online dictionary in pictures. If you have questions or suggestions, please reach out to us on WhatsApp or Twitter.Authors | Arjun Vishnu | @ArjunAndVishnu

I am Vishnu. I like AI, Linux, Single Board Computers, and Cloud Computing. I create the web & video content, and I also write for popular websites.
My younger brother, Arjun handles image & video editing. Together, we run a YouTube Channel that's focused on reviewing gadgets and explaining technology.


Comments powered by CComment