
Profiling Tools
Quick Navigation:
- Profiling Tools Definition
- Profiling Tools Explained Easy
- Profiling Tools Origin
- Profiling Tools Etymology
- Profiling Tools Usage Trends
- Profiling Tools Usage
- Profiling Tools Examples in Context
- Profiling Tools FAQ
- Profiling Tools Related Words
Profiling Tools Definition
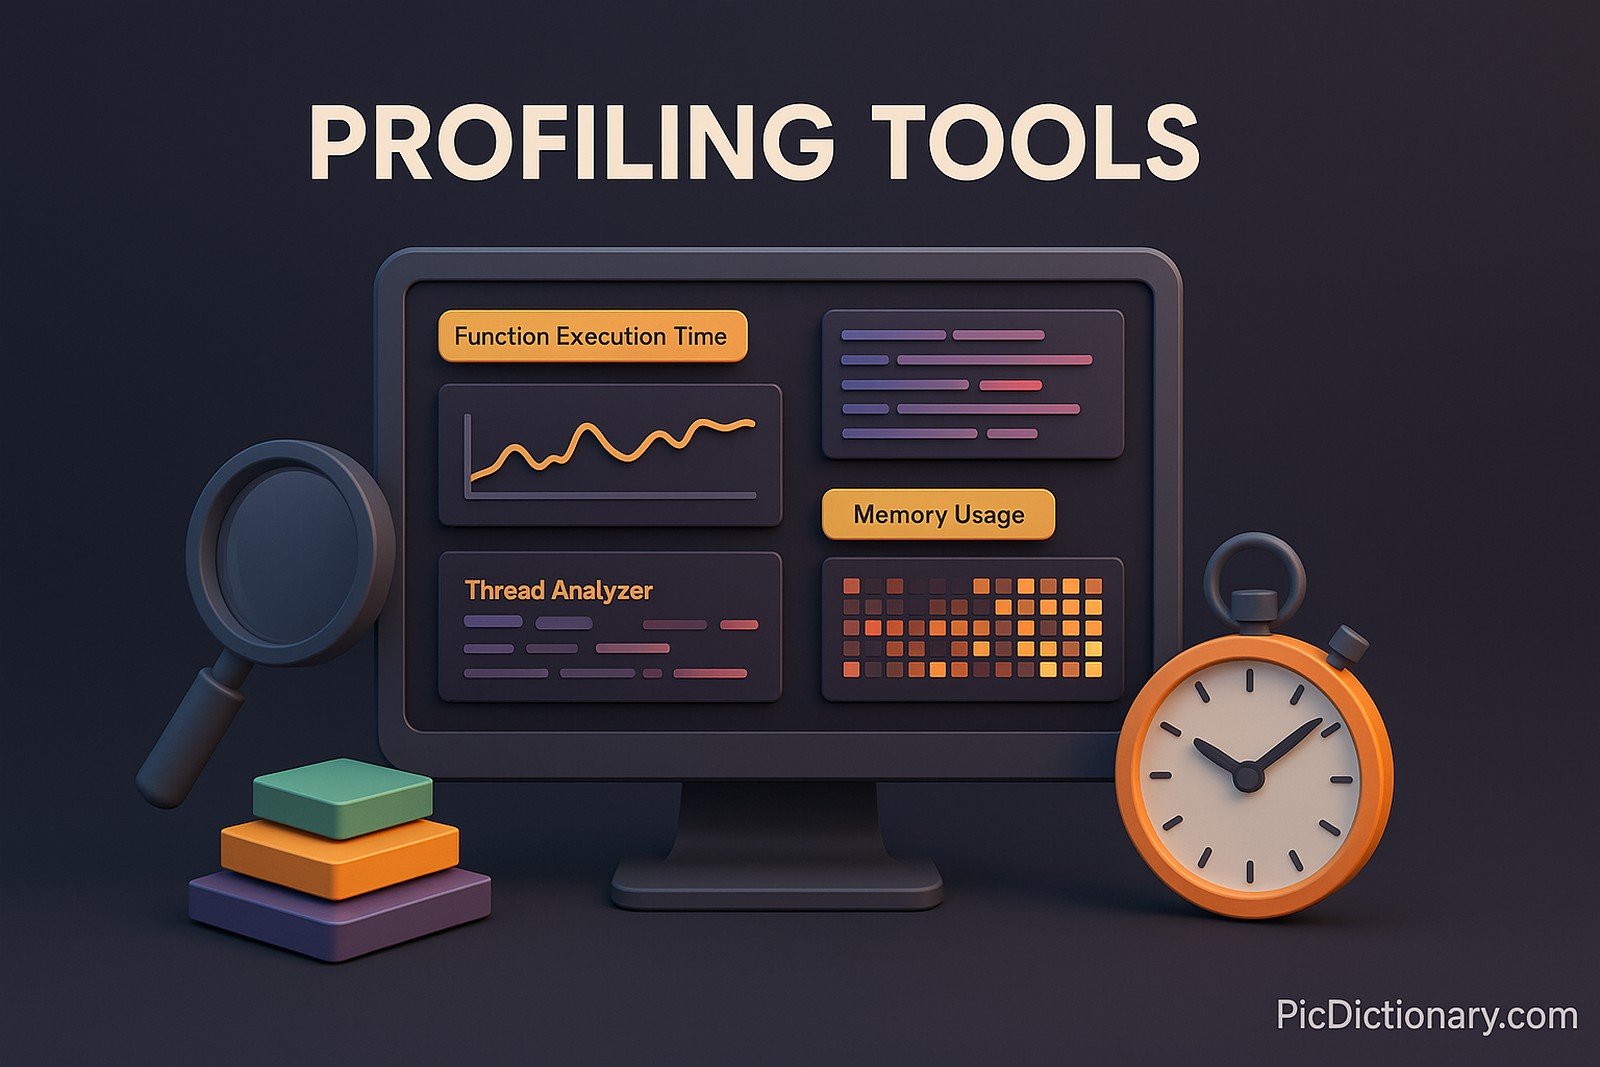
Profiling tools are software utilities designed to analyze and optimize program performance by measuring various aspects such as execution time, memory usage, and CPU load. They help developers identify bottlenecks, inefficiencies, and performance issues in code, enabling optimizations for better efficiency. Profiling tools are widely used in software development, particularly in high-performance computing, gaming, and data-intensive applications.
Profiling Tools Explained Easy
Imagine you’re playing a video game, and it starts lagging. A profiling tool is like a detective that investigates why the game is slow—maybe the graphics are too heavy, or something is using too much memory. Developers use these tools to find and fix problems so programs run faster and smoother.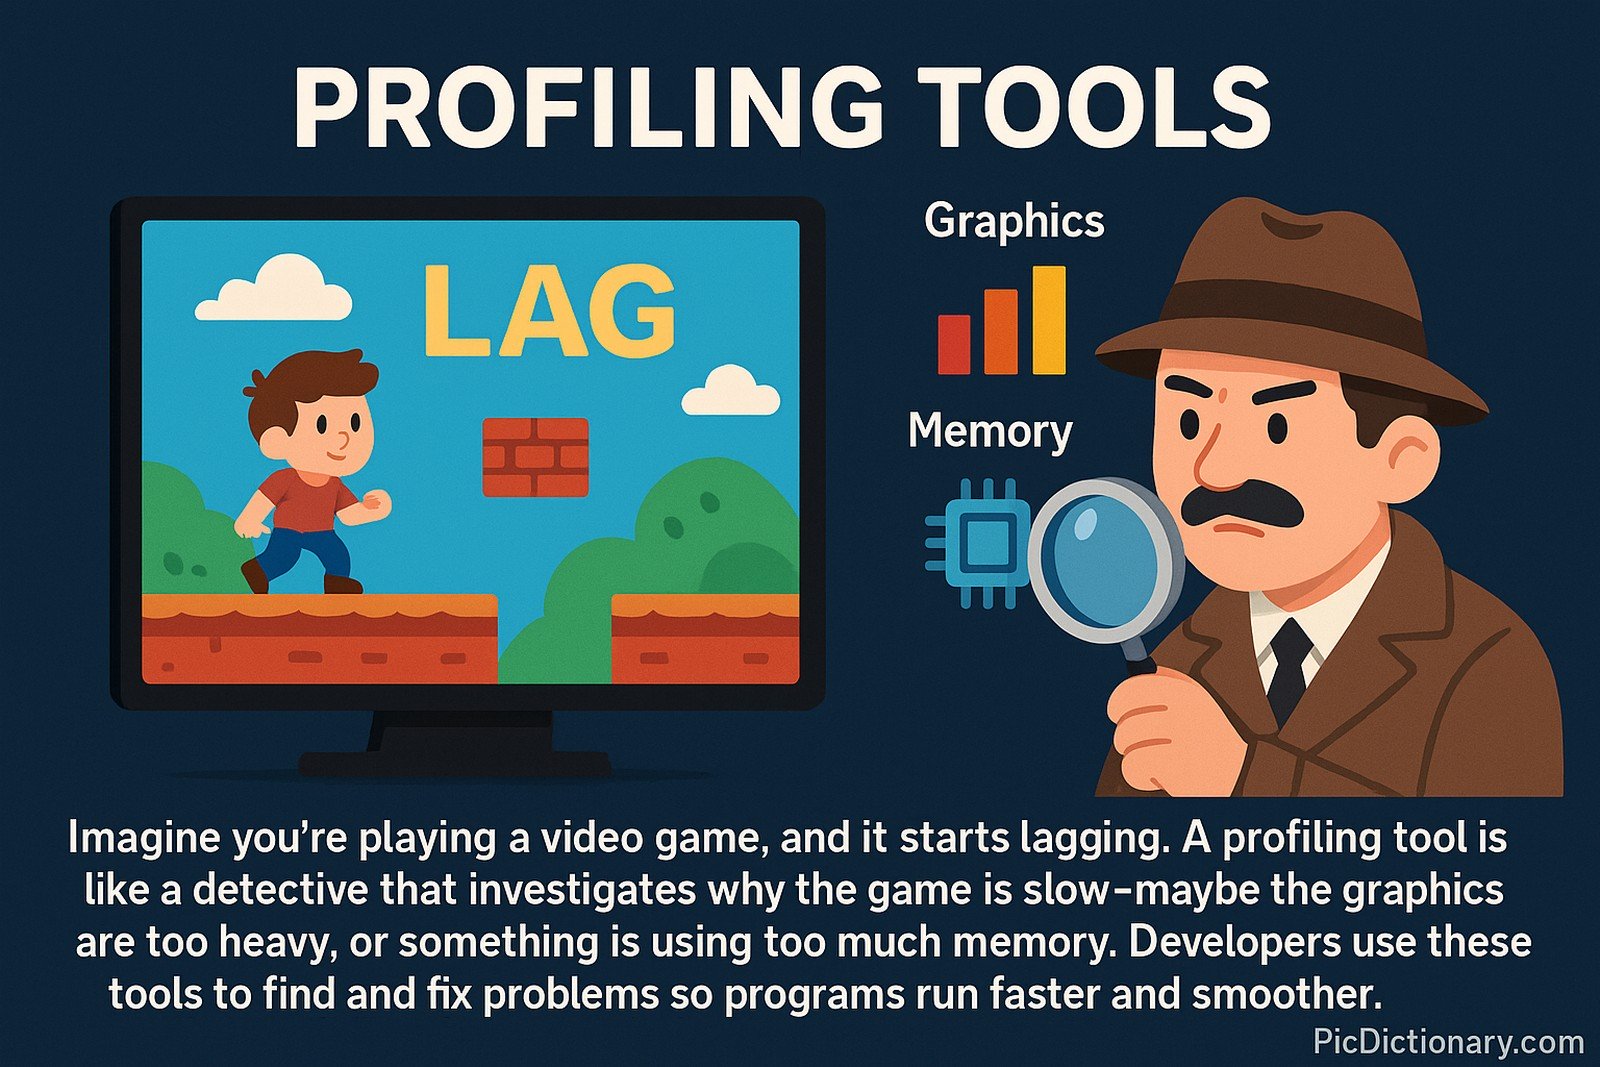
Profiling Tools Origin
Profiling tools emerged in the early days of computing when performance optimization became critical. As software complexity increased, developers needed specialized tools to diagnose slowdowns and inefficiencies. Early profiling techniques were manual, but modern tools automate performance tracking, providing real-time insights.
Profiling Tools Etymology
The term "profiling" originates from the idea of creating a "profile" or detailed analysis of a program’s execution, similar to how a personality profile captures traits and behaviors.
Profiling Tools Usage Trends
With the rise of large-scale applications and complex software, profiling tools have become essential in industries such as game development, cloud computing, and artificial intelligence. The demand for optimized software has increased the adoption of profiling tools in modern software engineering practices.
Profiling Tools Usage
- Formal/Technical Tagging:
- Software Performance Analysis
- Code Optimization
- Debugging Tools - Typical Collocations:
- "profiling tool for Python"
- "performance profiling software"
- "CPU and memory profiling"
- "profiling Java applications"
Profiling Tools Examples in Context
- Developers use profiling tools to detect memory leaks in applications.
- A game development team employs a profiling tool to reduce rendering lag.
- Data scientists use profiling tools to optimize machine learning algorithms.
Profiling Tools FAQ
- What is a profiling tool?
A profiling tool is software that analyzes and measures the performance of programs to optimize their efficiency. - How do profiling tools work?
They monitor execution time, memory usage, and CPU load to detect bottlenecks and suggest improvements. - Why are profiling tools important?
They help improve application speed, reduce resource consumption, and ensure efficient software performance. - What are some popular profiling tools?
Popular tools include Perf (Linux), Valgrind, gprof, VisualVM, and Intel VTune. - Can profiling tools be used in real-time applications?
Yes, some profiling tools provide real-time performance monitoring for live applications. - Are profiling tools used in web development?
Yes, developers use tools like Chrome DevTools and Lighthouse for web performance analysis. - What is the difference between profiling and debugging?
Debugging fixes errors, while profiling optimizes performance by identifying inefficiencies. - Do profiling tools affect performance?
Some tools introduce minor overhead, but they are designed to minimize impact while providing insights. - Are profiling tools useful for mobile app development?
Yes, mobile developers use profiling tools like Android Profiler and Xcode Instruments. - Can profiling tools analyze multi-threaded applications?
Yes, specialized tools can analyze multi-threading behavior and detect concurrency issues.
Profiling Tools Related Words
- Categories/Topics:
- Software Engineering
- Performance Optimization
- Code Analysis
Did you know?
Profiling tools played a key role in the development of early video game consoles. Developers used them to optimize memory and processing power, enabling smoother gameplay on limited hardware.
PicDictionary.com is an online dictionary in pictures. If you have questions or suggestions, please reach out to us on WhatsApp or Twitter.Authors | Arjun Vishnu | @ArjunAndVishnu

I am Vishnu. I like AI, Linux, Single Board Computers, and Cloud Computing. I create the web & video content, and I also write for popular websites.
My younger brother, Arjun handles image & video editing. Together, we run a YouTube Channel that's focused on reviewing gadgets and explaining technology.


Comments powered by CComment