
Code Profiler
Quick Navigation:
- Code Profiler Definition
- Code Profiler Explained Easy
- Code Profiler Origin
- Code Profiler Etymology
- Code Profiler Usage Trends
- Code Profiler Usage
- Code Profiler Examples in Context
- Code Profiler FAQ
- Code Profiler Related Words
Code Profiler Definition
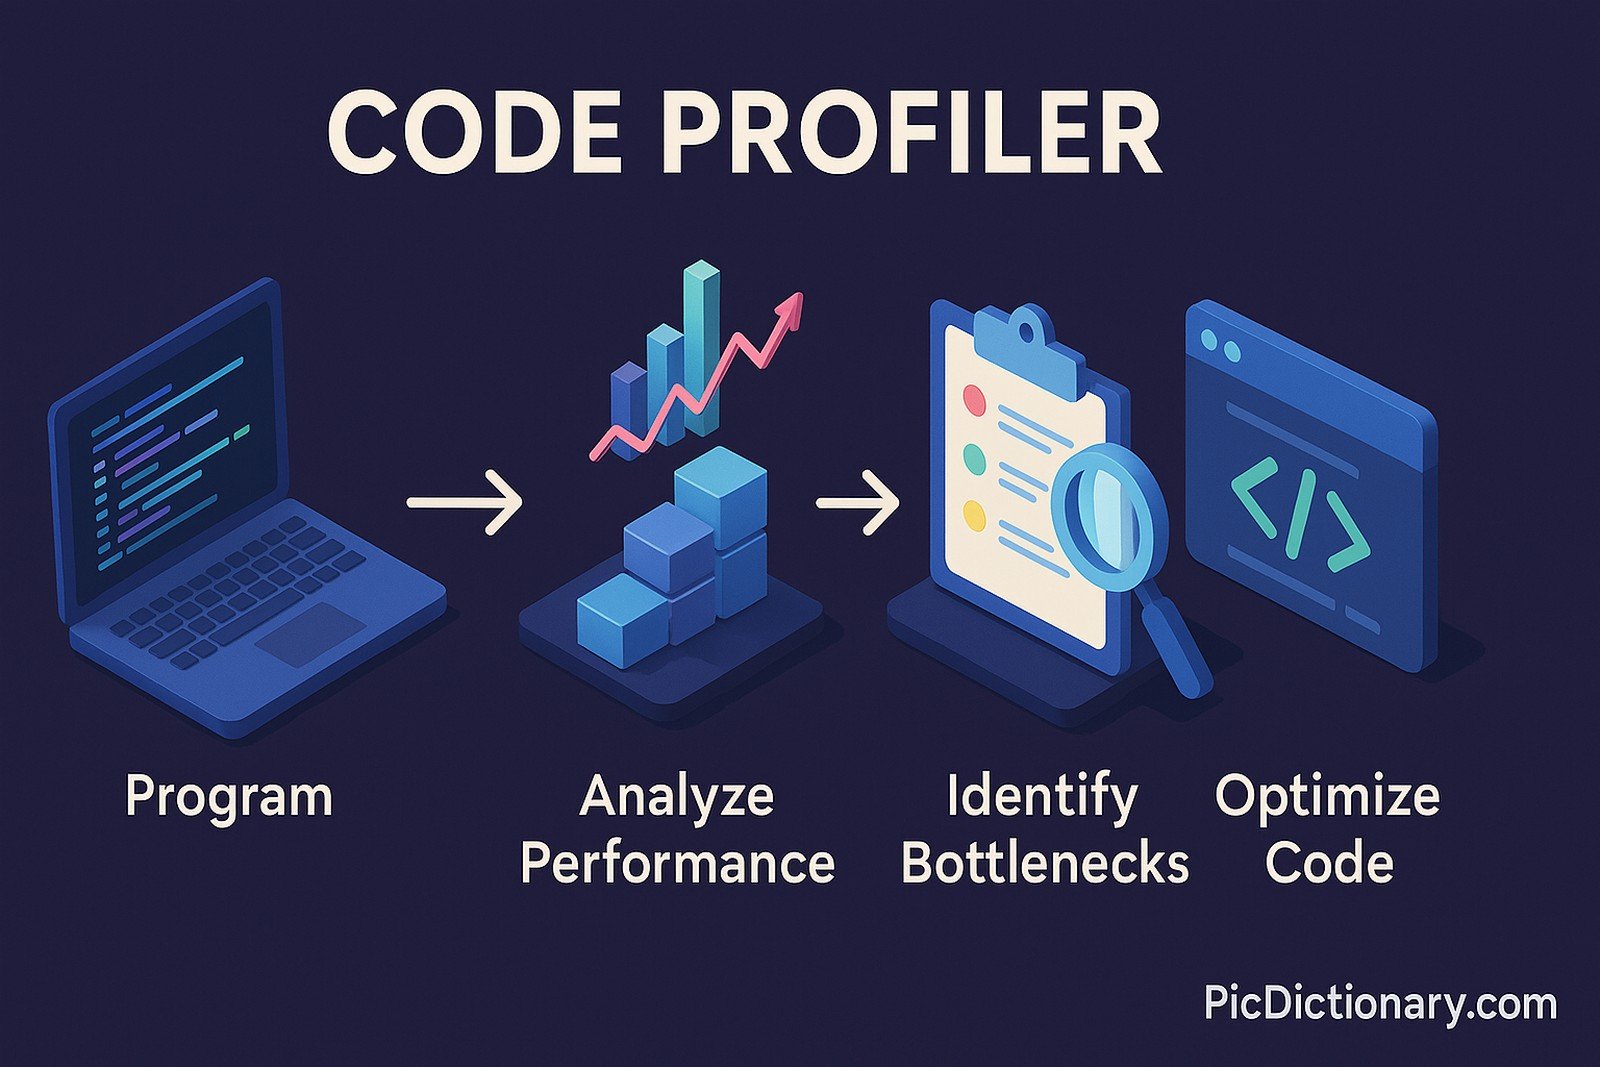
A code profiler is a software tool used to analyze the performance of a program by tracking function execution time, memory usage, and other runtime behaviors. It helps developers identify performance bottlenecks, optimize resource utilization, and enhance efficiency. Code profilers come in various types, including CPU profilers, memory profilers, and thread profilers, each designed to assess different aspects of software performance. These tools are essential for improving software responsiveness and debugging performance issues.
Code Profiler Explained Easy
Imagine you're baking a cake, but it’s taking too long. A code profiler is like a stopwatch that tells you which step in the baking process is slowing you down. It helps you find the slowest part so you can fix it and bake the cake faster. In software, a profiler does the same thing by analyzing which parts of a program take the most time or use the most memory.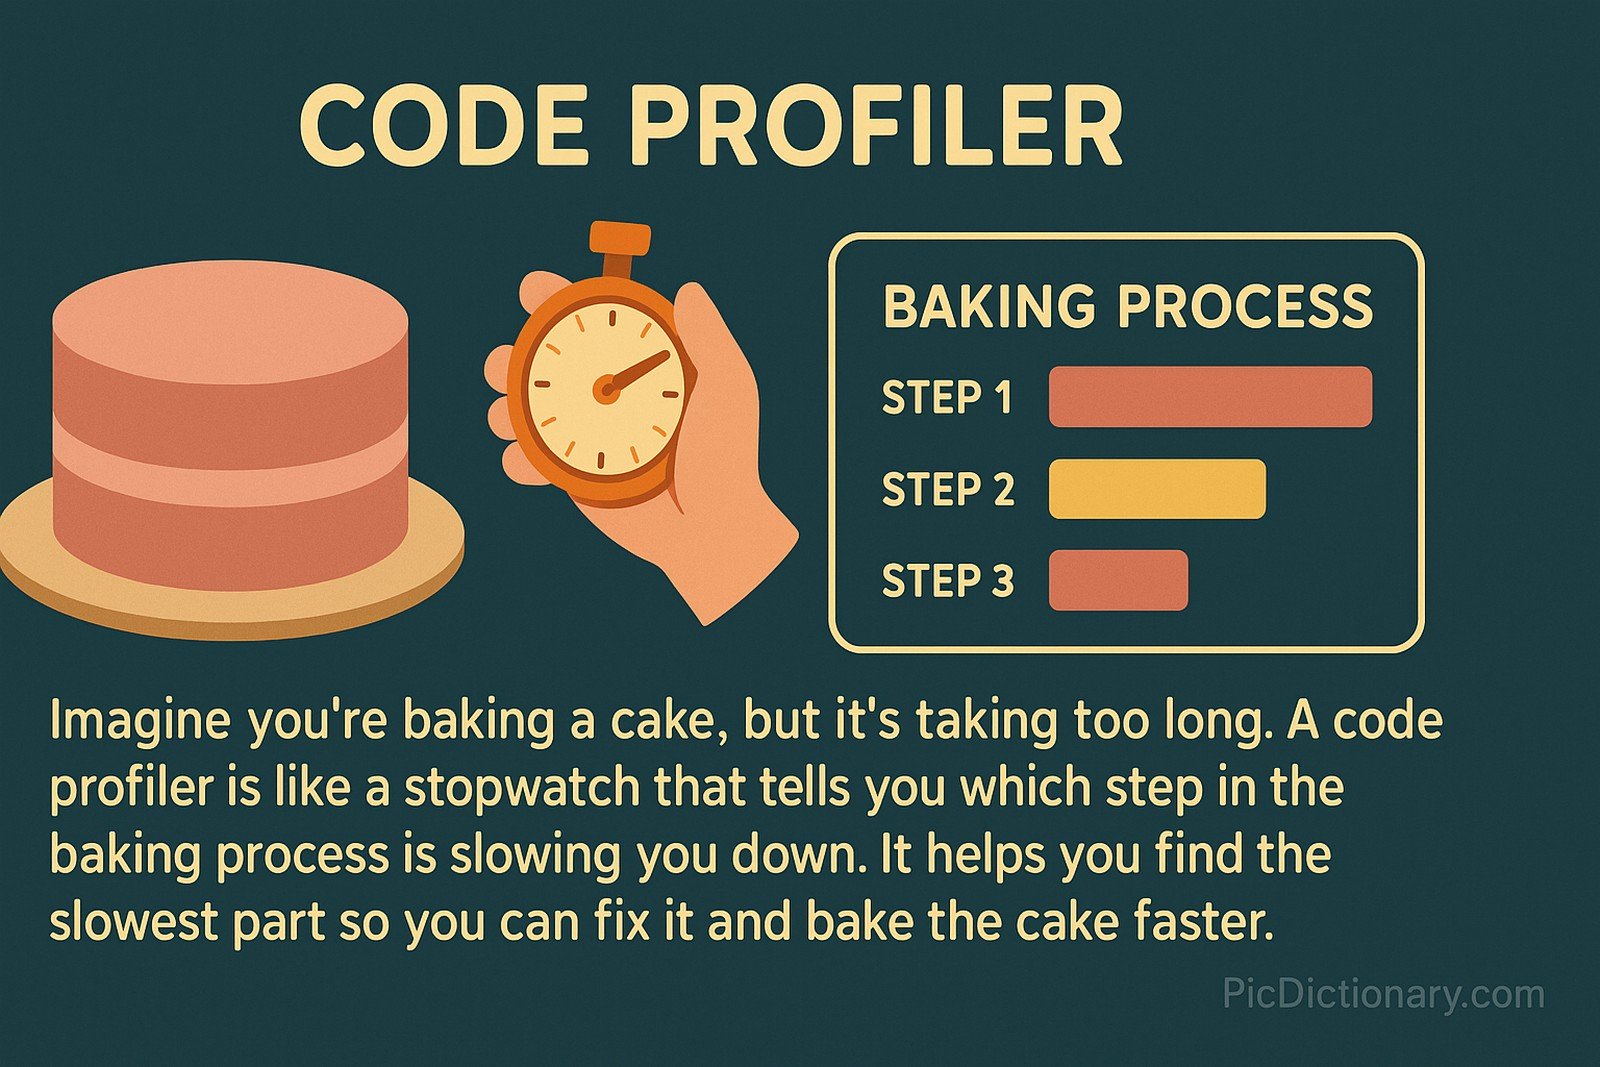
Code Profiler Origin
The concept of profiling dates back to the early days of computing when developers manually measured program execution times. The first automated code profilers emerged in the 1970s and 1980s as computers grew more complex. Today, modern profiling tools integrate seamlessly into software development environments to provide real-time analysis of application performance.
Code Profiler Etymology
The term "profiler" comes from "profiling," which refers to analyzing and summarizing characteristics. In computing, a code profiler creates a detailed execution profile of a program to identify performance issues.
Code Profiler Usage Trends
With the rise of cloud computing, mobile applications, and real-time systems, the need for efficient code profilers has grown significantly. Developers now rely on profilers to optimize software for various environments, from web applications to embedded systems. The increasing complexity of multi-threaded and distributed applications has also driven the development of more sophisticated profiling tools.
Code Profiler Usage
- Formal/Technical Tagging:
- Software Performance Analysis
- Debugging and Optimization
- Runtime Analysis - Typical Collocations:
- "Code profiler tool"
- "Performance bottleneck detection"
- "Memory profiling"
- "Execution time analysis"
Code Profiler Examples in Context
- A software engineer uses a code profiler to reduce lag in a video game.
- A mobile app developer profiles an application to optimize battery usage.
- A data scientist uses profiling tools to speed up machine learning model execution.
Code Profiler FAQ
- What is a code profiler?
A code profiler is a tool that analyzes software execution to identify performance bottlenecks and optimize efficiency. - Why is profiling important?
Profiling helps developers improve execution speed, reduce resource consumption, and enhance software reliability. - What types of code profilers exist?
There are CPU profilers, memory profilers, thread profilers, and network profilers. - How does a CPU profiler work?
A CPU profiler tracks function execution times to highlight slow-performing sections of code. - Can a code profiler detect memory leaks?
Yes, memory profilers help locate memory leaks and inefficient memory usage. - Is profiling only for performance optimization?
No, it’s also used for debugging, security testing, and analyzing unexpected behavior. - What are some popular code profilers?
Examples include Visual Studio Profiler, Perf (Linux), Valgrind, and JProfiler. - Does profiling slow down a program?
Some profilers introduce overhead, which may temporarily slow down execution during analysis. - How do I choose the right profiler?
It depends on the issue—CPU profilers analyze speed, while memory profilers track RAM usage. - Do all programming languages have profilers?
Most major programming languages have built-in or third-party profiling tools.
Code Profiler Related Words
- Categories/Topics:
- Software Development
- Performance Optimization
- Debugging Tools
Did you know?
The first widely used code profiler, gprof, was introduced in 1982 for Unix systems. Since then, profiling tools have evolved to support real-time and cloud-based monitoring, helping developers optimize software at scale.
PicDictionary.com is an online dictionary in pictures. If you have questions or suggestions, please reach out to us on WhatsApp or Twitter.Authors | Arjun Vishnu | @ArjunAndVishnu

I am Vishnu. I like AI, Linux, Single Board Computers, and Cloud Computing. I create the web & video content, and I also write for popular websites.
My younger brother, Arjun handles image & video editing. Together, we run a YouTube Channel that's focused on reviewing gadgets and explaining technology.


Comments powered by CComment