
Debugging Symbols

Quick Navigation:
- Debugging Symbols Definition
- Debugging Symbols Explained Easy
- Debugging Symbols Origin
- Debugging Symbols Etymology
- Debugging Symbols Usage Trends
- Debugging Symbols Usage
- Debugging Symbols Examples in Context
- Debugging Symbols FAQ
- Debugging Symbols Related Words
Debugging Symbols Definition
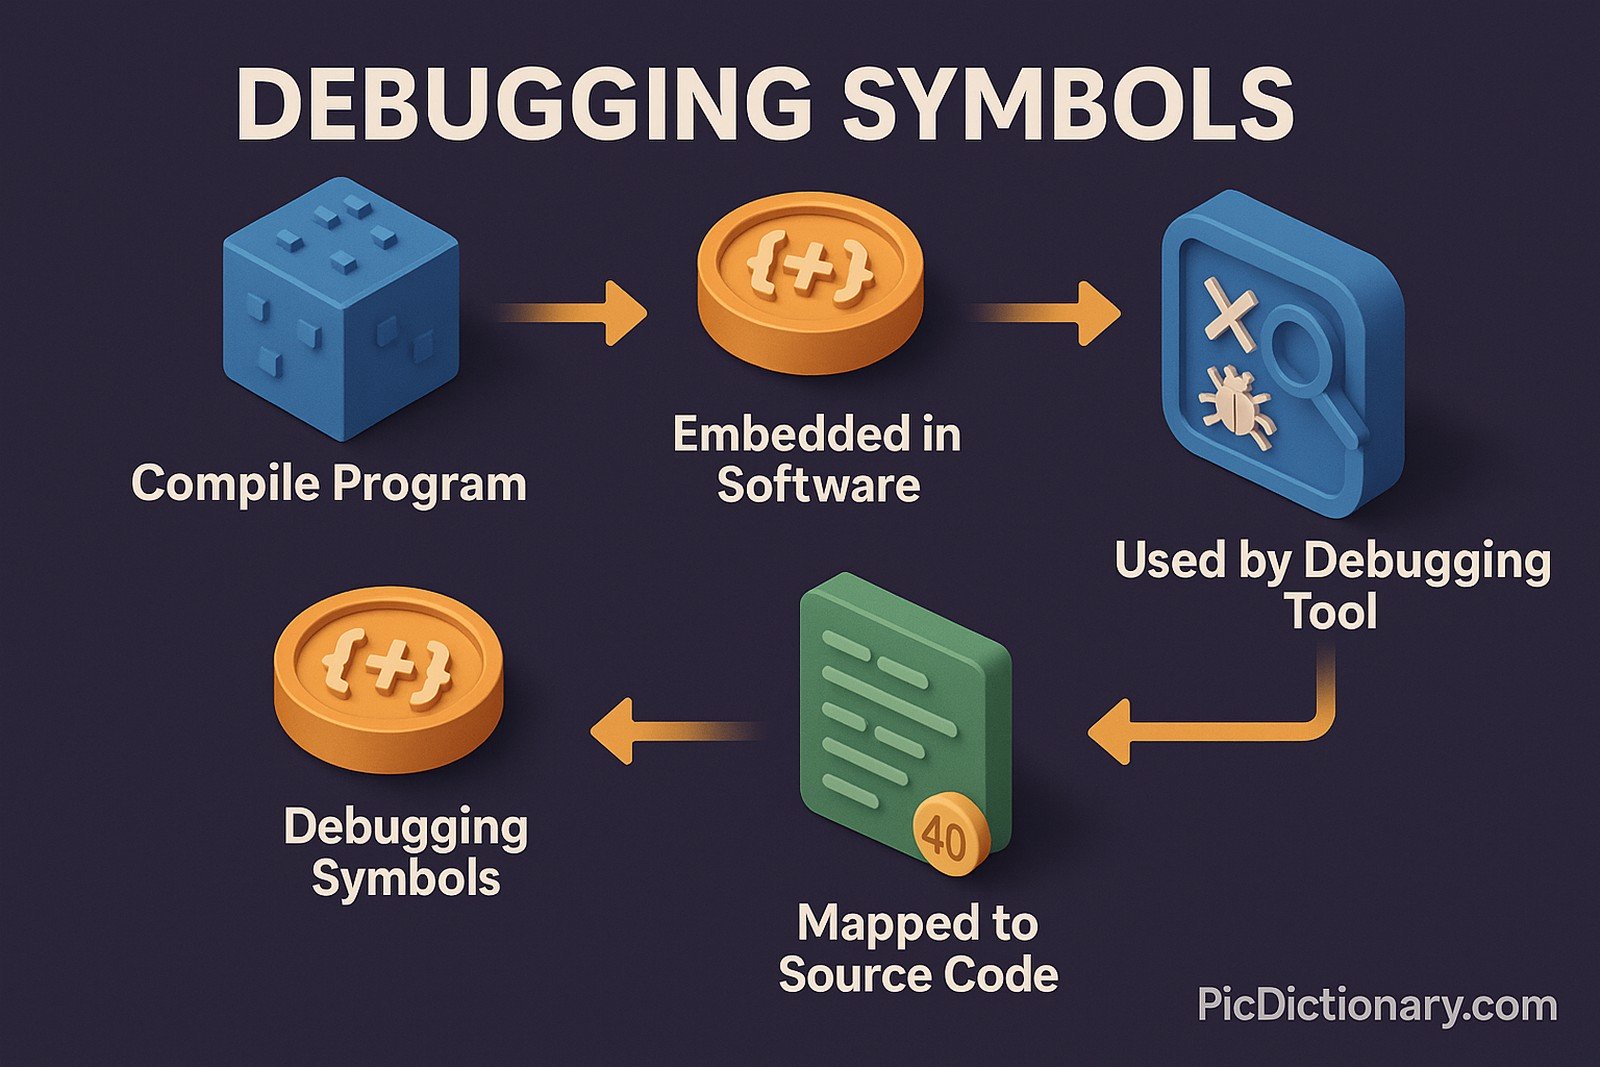
Debugging symbols are special markers embedded in compiled software to help developers analyze and troubleshoot issues in their programs. These symbols provide metadata about the code, such as variable names, function names, and line numbers, enabling efficient debugging. They do not affect the program’s execution but assist debugging tools in mapping machine code back to the original source code. Debugging symbols are essential for diagnosing crashes, profiling performance, and understanding program flow.
Debugging Symbols Explained Easy
Imagine you built a LEGO set, but later, you find some pieces missing. If you had a guide with labels for every brick, you could quickly figure out which pieces are missing and where they belong. Debugging symbols work the same way—they label parts of a program so developers can track down errors and fix them easily.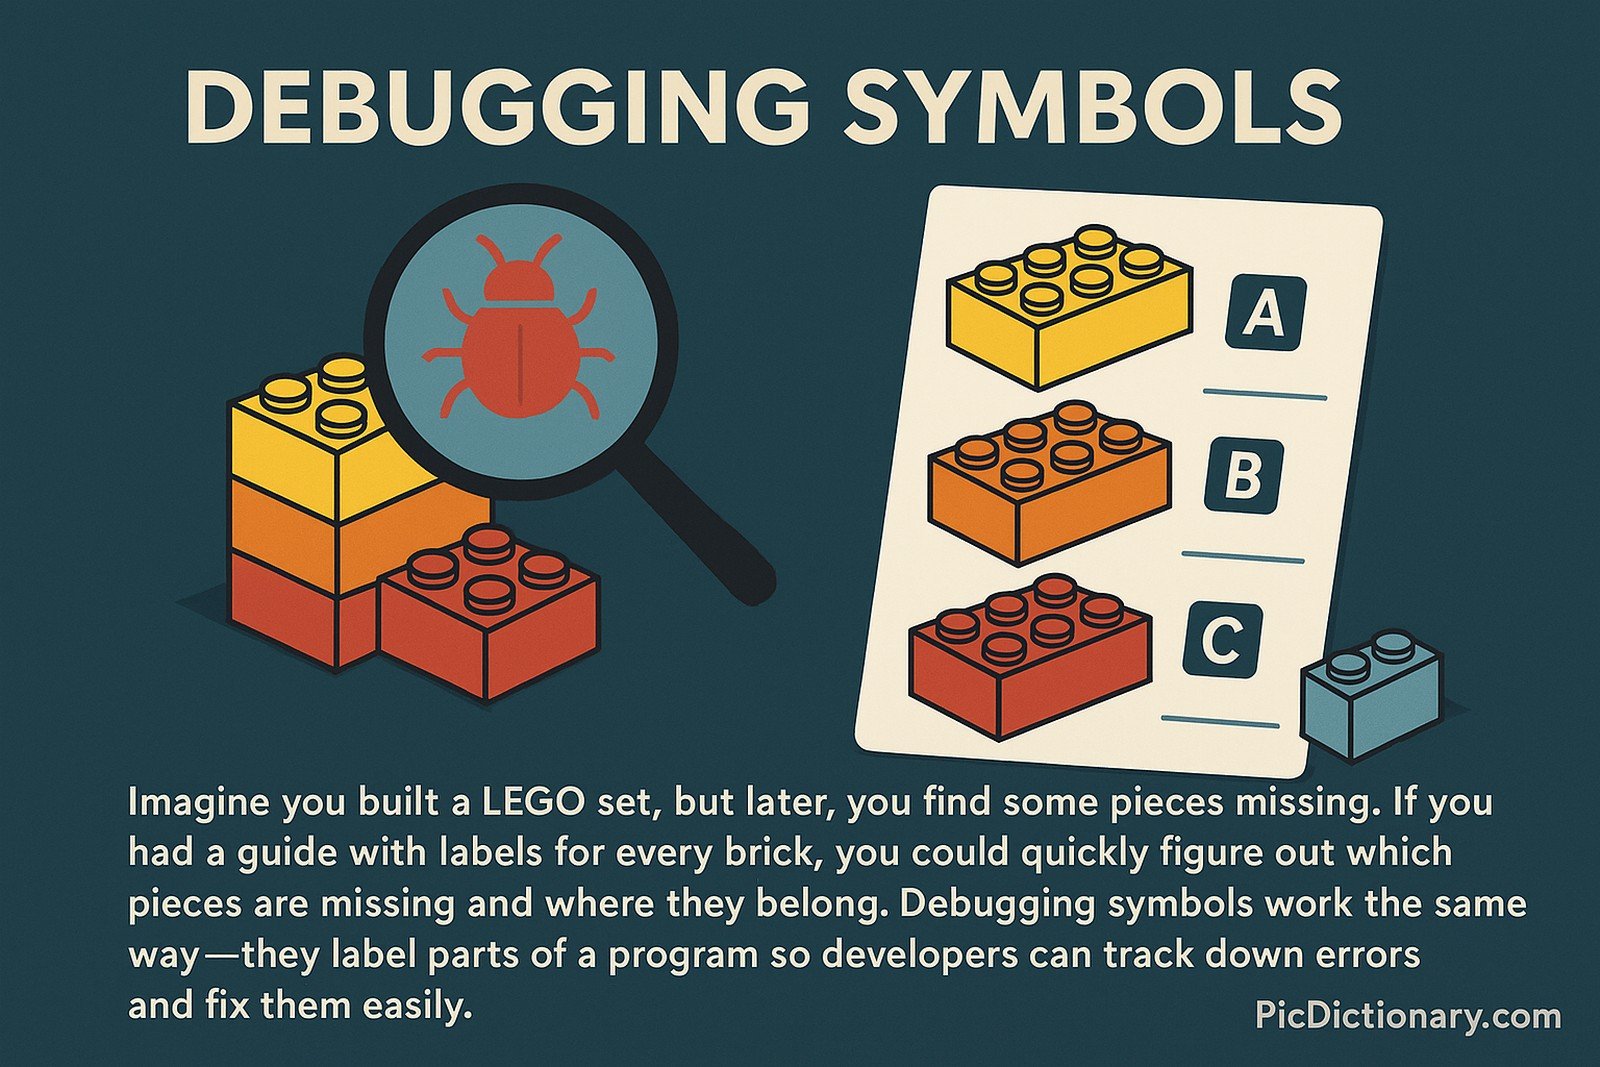
Debugging Symbols Origin
Debugging symbols originated from early debugging tools used in assembly language development. As software grew in complexity, developers needed better ways to trace errors. By the 1970s and 1980s, debugging symbols became an integral part of compilers, allowing more efficient debugging of high-level programming languages.
Debugging Symbols Etymology
The term “debugging symbols” comes from “debugging,” meaning to find and fix errors, and “symbols,” which refers to the symbolic information added to assist in understanding compiled programs.
Debugging Symbols Usage Trends
Debugging symbols have become increasingly important as software grows more complex. Developers rely on them in integrated development environments (IDEs), crash dump analyzers, and performance profilers. While production software often omits them for security and size reasons, they are widely used in testing and development environments to improve software reliability.
Debugging Symbols Usage
- Formal/Technical Tagging:
- Software Development
- Debugging
- Compilation - Typical Collocations:
- "generate debugging symbols"
- "strip debugging symbols"
- "debugging symbols missing"
- "enable debugging symbols in compiler"
Debugging Symbols Examples in Context
- A developer enabled debugging symbols in their program to analyze a crash dump and pinpoint the exact function that caused the issue.
- Debugging symbols helped a software engineer step through their application in a debugger to identify an off-by-one error.
- To reduce file size, a production build of the software was stripped of debugging symbols, while a separate symbol file was maintained for troubleshooting.
Debugging Symbols FAQ
- What are debugging symbols?
Debugging symbols are metadata in compiled programs that help map machine code back to source code for troubleshooting. - Why are debugging symbols important?
They allow developers to diagnose issues, profile performance, and understand the program’s execution flow. - Do debugging symbols affect program performance?
No, they do not impact execution speed but can increase the size of compiled binaries. - How do you generate debugging symbols?
Most compilers have an option (e.g., `-g` in GCC) to include debugging symbols in the compiled output. - Can debugging symbols be removed?
Yes, tools like `strip` can remove debugging symbols to reduce binary size. - Are debugging symbols needed in production software?
Generally, they are removed from production builds for security and size reasons, but separate debug symbol files are often kept for analysis. - Which tools use debugging symbols?
Debuggers (e.g., GDB, LLDB), crash analyzers, and profiling tools use debugging symbols to aid developers. - What happens if debugging symbols are missing?
Debuggers will only show raw memory addresses instead of function names and source code locations, making troubleshooting harder. - Do all programming languages use debugging symbols?
Languages that compile to machine code typically use debugging symbols, while interpreted languages rely on different debugging mechanisms. - How do debugging symbols help in crash analysis?
They map memory addresses in crash reports back to the original source code, helping developers identify the cause of the crash.
Debugging Symbols Related Words
- Categories/Topics:
- Software Debugging
- Compiler Technology
- Crash Analysis
Did you know?
Debugging symbols were crucial in uncovering major software bugs in operating systems and enterprise applications. For example, Microsoft uses symbol servers to provide debugging symbols for Windows, enabling developers worldwide to diagnose system crashes efficiently.
PicDictionary.com is an online dictionary in pictures. If you have questions or suggestions, please reach out to us on WhatsApp or Twitter.Authors | Arjun Vishnu | @ArjunAndVishnu

I am Vishnu. I like AI, Linux, Single Board Computers, and Cloud Computing. I create the web & video content, and I also write for popular websites.
My younger brother, Arjun handles image & video editing. Together, we run a YouTube Channel that's focused on reviewing gadgets and explaining technology.


Comments powered by CComment