
Performance Profiling
(Representational Image | Source: Dall-E)
Quick Navigation:
- Performance Profiling Definition
- Performance Profiling Explained Easy
- Performance Profiling Origin
- Performance Profiling Etymology
- Performance Profiling Usage Trends
- Performance Profiling Usage
- Performance Profiling Examples in Context
- Performance Profiling FAQ
- Performance Profiling Related Words
Performance Profiling Definition
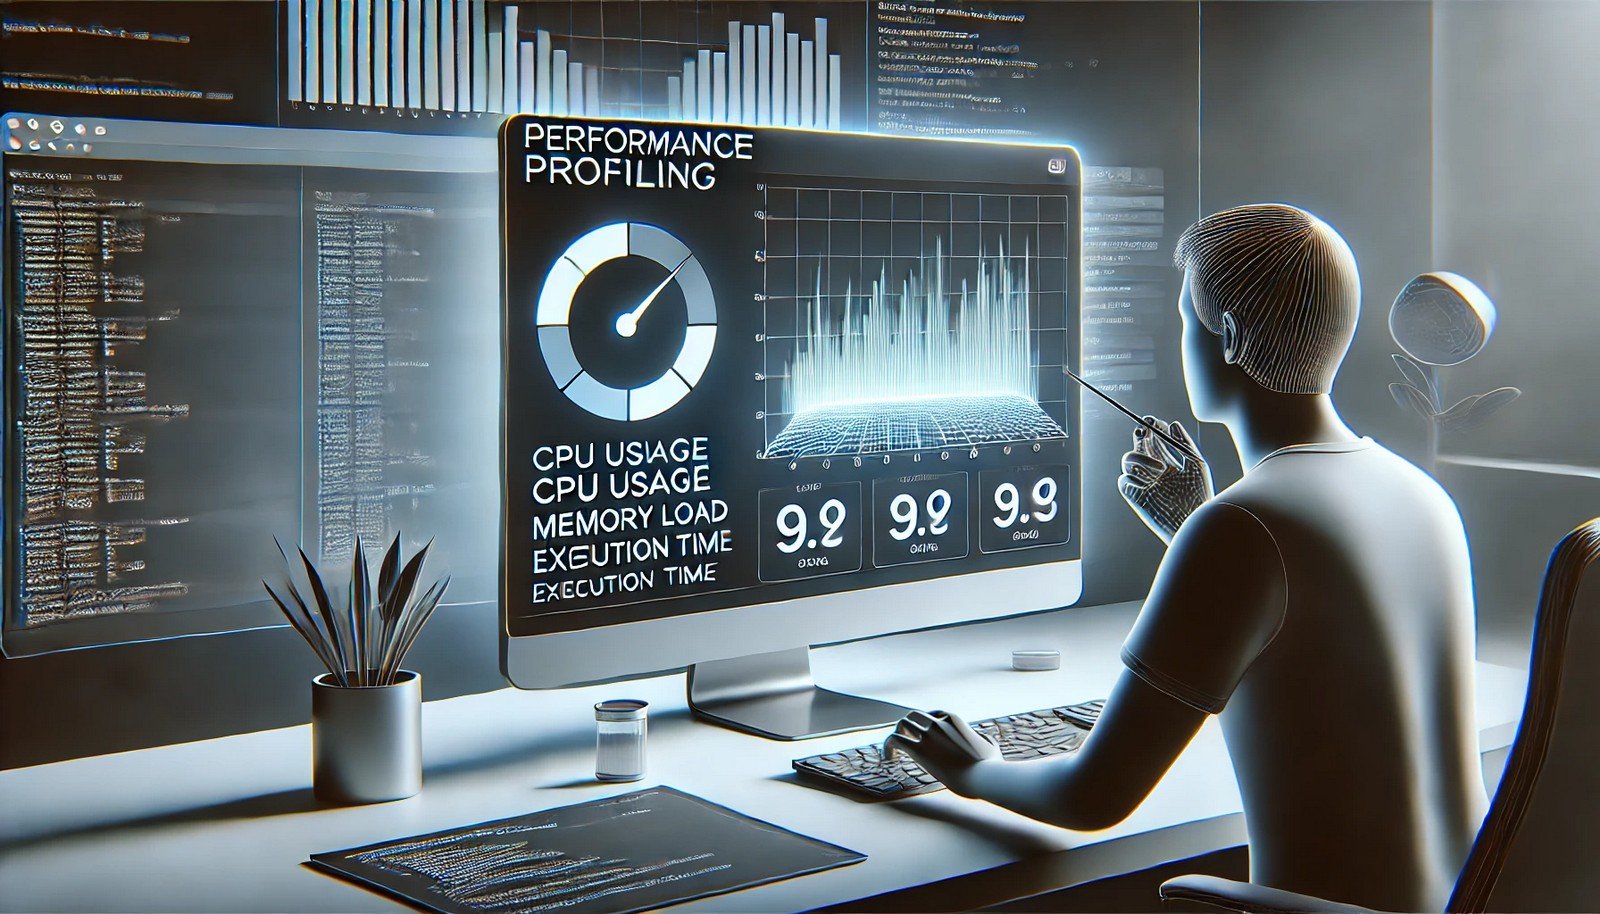
Performance profiling is the process of analyzing a software application to identify bottlenecks, optimize execution speed, and improve overall efficiency. It involves measuring CPU usage, memory consumption, execution time, and other system resources to determine how different parts of the software perform under various conditions. Profiling tools, such as gprof, Valgrind, and Perf, help developers pinpoint slow functions, memory leaks, and inefficient code paths.
Performance Profiling Explained Easy
Think of performance profiling like checking how fast different parts of a video game load. If one part takes too long, the game might lag. Profiling helps find slow parts so developers can make them faster, just like fixing a slow-loading game to make it run smoothly.
Performance Profiling Origin
Performance profiling emerged in the early days of computing when optimizing resource usage was essential due to limited processing power. As software complexity grew, developers needed systematic ways to track and improve performance. Early profiling tools focused on CPU time analysis, later expanding to memory and network performance.
Performance Profiling Etymology
The term "performance profiling" combines "performance," meaning how well something works, and "profiling," which refers to creating a detailed analysis of something. In computing, it signifies the structured examination of how efficiently software runs.
Performance Profiling Usage Trends
With the rise of large-scale applications, performance profiling has become increasingly important. Cloud computing, mobile applications, and gaming industries rely on profiling to ensure smooth user experiences. Developers use profiling to optimize AI models, reduce battery drain in mobile devices, and enhance web application responsiveness.
Performance Profiling Usage
- Formal/Technical Tagging:
- Software Optimization
- Code Performance Analysis
- System Resource Management - Typical Collocations:
- "performance profiling tool"
- "CPU profiling"
- "memory profiling analysis"
- "profiling software efficiency"
Performance Profiling Examples in Context
- A developer uses a performance profiler to detect memory leaks in a web application, improving load speed.
- Game developers use CPU profiling to ensure smooth gameplay by optimizing slow functions.
- Profiling is crucial in AI, helping improve machine learning model inference speeds.
Performance Profiling FAQ
- What is performance profiling in software development?
Performance profiling is the analysis of software execution to optimize efficiency and reduce resource consumption. - How does performance profiling help in software optimization?
It identifies performance bottlenecks, allowing developers to optimize slow functions, reduce memory leaks, and improve responsiveness. - What are common tools used for performance profiling?
Popular tools include gprof, Valgrind, Perf, Visual Studio Profiler, and Intel VTune. - Is performance profiling necessary for all software projects?
While not always mandatory, it is essential for large-scale applications, real-time systems, and performance-critical software. - Can performance profiling help in debugging?
Yes, it aids debugging by revealing inefficient code, memory leaks, and execution delays. - What’s the difference between profiling and benchmarking?
Profiling analyzes specific code performance, while benchmarking measures overall system performance under defined conditions. - How does CPU profiling differ from memory profiling?
CPU profiling focuses on execution speed and processing load, while memory profiling tracks memory usage and potential leaks. - Is performance profiling useful in mobile app development?
Yes, it helps optimize battery consumption, app responsiveness, and load times. - Can performance profiling be automated?
Yes, automated profiling tools monitor software performance continuously during development and production. - What role does performance profiling play in cloud computing?
It optimizes resource usage, ensuring cost-efficiency and scalability in cloud-based applications.
Performance Profiling Related Words
- Categories/Topics:
- Software Development
- Code Optimization
- System Performance Analysis
Did you know?
One of the earliest profiling tools, gprof, was introduced in the 1980s as part of Unix. Over time, profiling tools have evolved, allowing real-time monitoring and visualization of software performance, making modern applications significantly more efficient.
PicDictionary.com is an online dictionary in pictures. If you have questions or suggestions, please reach out to us on WhatsApp or Twitter.Authors | Arjun Vishnu | @ArjunAndVishnu

I am Vishnu. I like AI, Linux, Single Board Computers, and Cloud Computing. I create the web & video content, and I also write for popular websites.
My younger brother, Arjun handles image & video editing. Together, we run a YouTube Channel that's focused on reviewing gadgets and explaining technology.


Comments powered by CComment